 BioPhysCode
This tutorial provides a minimum working example (MWE) for an analysis scheme which may help you organize your code.
The calculator code (omnicalc) does two things: it runs calculations (one per simulation, saved to disk) and it plots results from many simulations. Typically plot scripts have a specific prefix i.e. calc/plot-protein_rmsd.py and are automatically detected by the factory and listed on the calculator page for the factory graphical user interface (GUI). These plot scripts can be converted into interactive notebooks in GUI and then executed directly, saving plots to a special folder and presenting them in the notebook and on the calculator page. All plot scripts can also be run from the command line by running commands like make plot protein_rmsd, as long as you have correctly prepared the metadata. This method always leaves the user in an interactive python session so they can inspect the data or develop more code. The user can run replot() in this session to re-execute the code during development. This is the standard method for analyzing results.
There is also an alternate, autoplot method which adds a few features. Plot scripts which use this scheme can contain a decorated function which only runs once, even if the user runs replot() many times to update their plots. This is useful when there is a lengthy loading process, in the case of very large calculation results, or if you would like to perform extensive post-post-processing (that’s not a typo — the calculations produce the “post-procesing” data). Every local variable in the loader function is exposed to globals so they do not need to be passed between functions.
An autoplot script can also contain specific decorated plot functions which can be plotted on the command line without an interactive terminal using commands like make plot undulations undulation_spectra, where the undulation_spectra function may be one of many plotting functions. This allows users to set default plot routines or call on specific plots which are not always run when the script is invoked. Since “plotting” is the only way that users can compare simulations, we have even relaxed the naming scheme so you can make a file called e.g. compare_structures.py which compares all of your simulations and then run specific functions with e.g. make go compare_structures comparison_dev.
To demonstrate the autoplot scheme, create a plot script called demonstrate_autoplot.py with the following contents.
#!/usr/bin/env python

"""
AUTOPLOT DEMONSTRATION

Setting `autoplot: True` in the metadata `director` or inside an individual plot will allow you to use a few
neat features which we call "autoplot" and make use of decorated functions to manage plotting.

Instructions:

1. Add the following entry to a specs file. Replaces `collections` and `calculation` with existing ones.

plots:
  demo_autoplot:
    script: demonstrate_autoplot.py
    autoplot: True
    collections: cgmd_bilayers
    calculation: undulations

2. Run `make go demo_autoplot`. The omnicalc output tells you what has been executed.
3. Change the function. Run `replot()` to see that it changed.
4. Set `plotrun.routine = []` so nothing is plotted.
5. Use the `if __name__=='main':` block to develop new code in globals.
6. Exit and run `make go demo_autoplot plot2` to run one plot, non-interactively.

"""

# The routine below tells us which plots to run. Note that None means everything,
# ... [] means nothing, otherwise this list names the decorated plot functions to run, by default.
plotrun.routine = None

import re,textwrap

def say(msg): status(tag='tutorial',string=textwrap.fill(re.sub('(\n|\t|\s)+',' ',msg.strip()),80))

@autoload(plotrun)
def load_ignored():
    """Dummy autoload to illustrate the perils of decorating twice."""
    print("I will never run because I am not the last-decorated autoload functio. Sad!")


@autoload(plotrun)
def load():
    """
    Load and post-process data.
    """
    import re,textwrap
    message = """
    Designate a "load" function of any name with the decorator `@autoload(plotrun)`.
    This function will run once when the script is started, but it will be ignored when you use the
    `replot()` function to run the script again. The purpose of `replot()` is to redo any plots you are
    making *without* loading or performing any post-processing. This saves time. This function also
    exports all locals to globals so they do not need to be passed. Rerun this function during development
    with its name `load()`. It will only be updated after `replot()`.
    """
    numbers = np.random.random(10)
    status(tag='load',string='The `load` function has generated some numbers:\n\n%s\n'%numbers)
    say(message)


@autoplot(plotrun)
def plot():
    """Plot the data. Make changes and `replot()` without running the loader again."""
    message = """I am a plot function called `plot` which has been decorated with `@autoplot(plotrun)`.
    I found numbers randomly generated in the load function and automatically exposed to globals. If you
    run `replot()` then I will run again, even if you changed the code. Try uncommenting the line at the
    end and then run `replot()`."""
    status(tag='load',string='The numbers are:\n\n%s\n'%numbers)
    say(message)
    #! print('edit the script and run `replot()` without exiting python or reloding. neat!')
    # uncomment the above and run `replot()` to see how it works

@autoplot(plotrun)
def plot2():
    """Another plot function to demonstrate the routine."""
    message = """I am another plot function creatively called `plot2`. I will always run on `replot()`
    as long as `plotrun.routine = None` is found in the script. If you set `plotrun.routine = []` instead,
    then nothing will run. If you set `plotrun.routine = ["plot2"]` then only I will run, and the other plot
    function `plot` will not. Note that any function which is decorated with `@autoplot(plotrun)` will run
    automatically unless you change plotrun.routine. Any of these functions can be individually executed
    from the command line without using the interactive mode by using `make go plot_name plot_function`.
    """
    say(message)

if __name__=='__main__':
    message = """If you want to iteratively code up a plot in globals, you can use the usual method, by
    placing it in `if __name__=='__main__':` so that it will only run after we run the load function and
    any other plot functions. When it's working correctly, it's best to make it into a plot function by
    decorating it with `@autoplot(plotrun)`. Any changes to this main loop will also take effect when
    running `replot()`."""
    say('Now we are in the main loop.')
    say(message)
Then, add the following entry to your plots metadata. Ensure that you have a calculation called undulations by adding this to an existing demonstration. We recommend piggybacking this on the end of the single pipeline walkthrough.
plots:
  demo_autoplot:
    script: demonstrate_autoplot.py
    autoplot: True
    collections: cgmd_bilayers
    calculation: undulations
Navigate to the omnicalc directory, typically at factory/calc/project_name. Note that make go is equivalent to make plot, to reflect the fact that “plot” scripts can be used for extensive analysis. We also set script: demonstrate_autoplot.py otherwise the code assumes the default name, which would be plot-demo_autoplot.py in this case. If you need to save data to disk, you should either use the store function at omni.base.store in your code or write a calculation, otherwise, you can use autoplot for extra analysis (this is why we allow make go as well as make plot).
Run make go demo_autoplot. The output is given in a screenshot below.
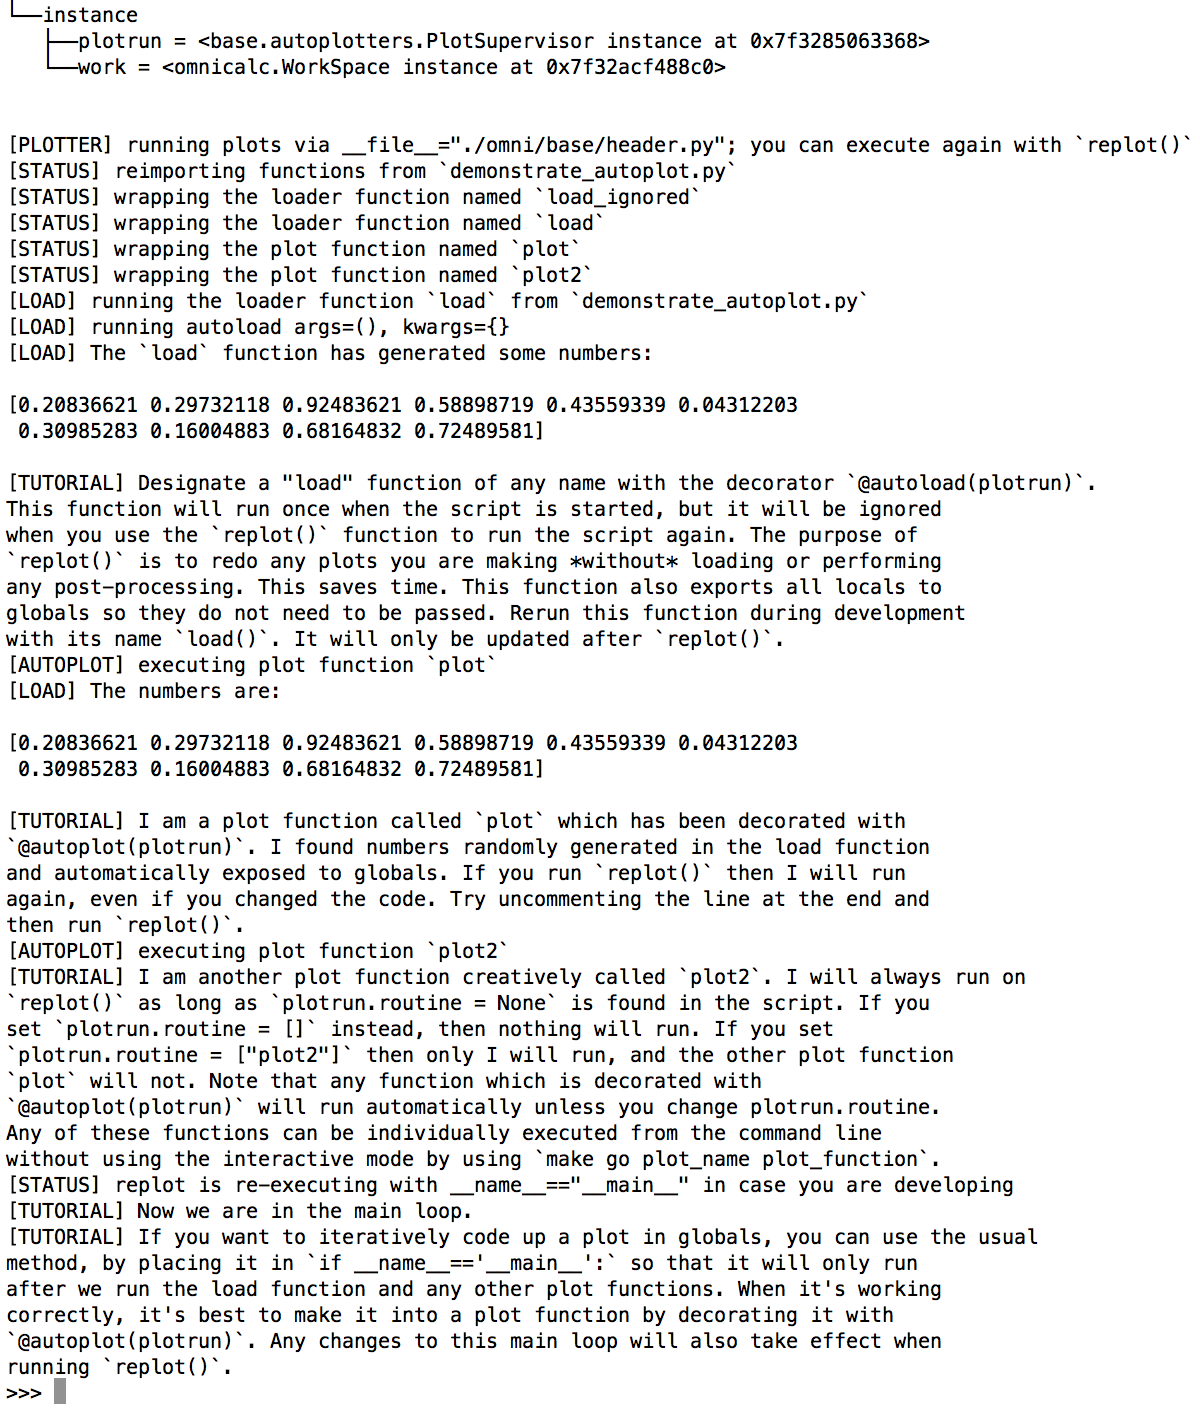
The instructions explain how the code is executed, but in short, this script runs the load function first, dumps all of its locals into globals, and then executes every function decorated with @autoplot(plotrun).
You can set plotrun.routine = ['plot2'] to ensure that a generic call to make go demo_autoplot only runs that function, ignoring the plot function. You can also set plotrun.routine = [] to run nothing, and use the standard if __name__=='__main__': conditional to develop code in the global namespace. You can always manipulate plotrun.routine on-the-fly. Lastly,
The script provided above includes all of the features in the autoplot scheme, reviewed below.
- A single function decorated with
@autoload(plotrun)runs only once even if you repeatedly runreplot()while developing your code. The load function runs before any global code if it is under aif __name__=='__main__':block. All locals are exposed to the global namespace so you don’t have to pass them around. - Any functions decorated with
@autoplot(plotrun)will run after loading. - These plot functions can be plotted without the interactive python session using
make go plot_name function_name. - These functions are chosen by the
plotrun.routinevariable so that some non-standard plots can be ignored during normal execution and then selectively executed from the command line, or inside the interactive session.
You are welcome to set director: {'autoplot':True} in your metadata to ensure that all plots use this scheme, otherwise you can set autoplot: True in the metadata (see the example) above to use it on individual plots. The autoplot scheme was designed to eliminate conditionals and excessive control flow in existing plots developed by the authors. The use of decorators, the plotrun.routine variable, and the control over the load function is useful when developing sprawling, modular analysis and plotting routines.